Lab 04: Methods for Nondestructive Evaluation
AE 417 · Aerospace Structures and Instrumentation Laboratory · Fall 2025 · ERAU
Experiment Overview
Every aircraft in service is inspected continuously using nondestructive evaluation (NDE) methods — techniques that find damage without harming the part being inspected. NDE is what allows airlines to operate aging aircraft safely and enables manufacturers to certify composite primary structures. This lab provided hands-on exposure to five complementary NDE techniques applied to real aerospace hardware: visual inspection (borescope), thermography, radiography, liquid penetrant, and ultrasonics.
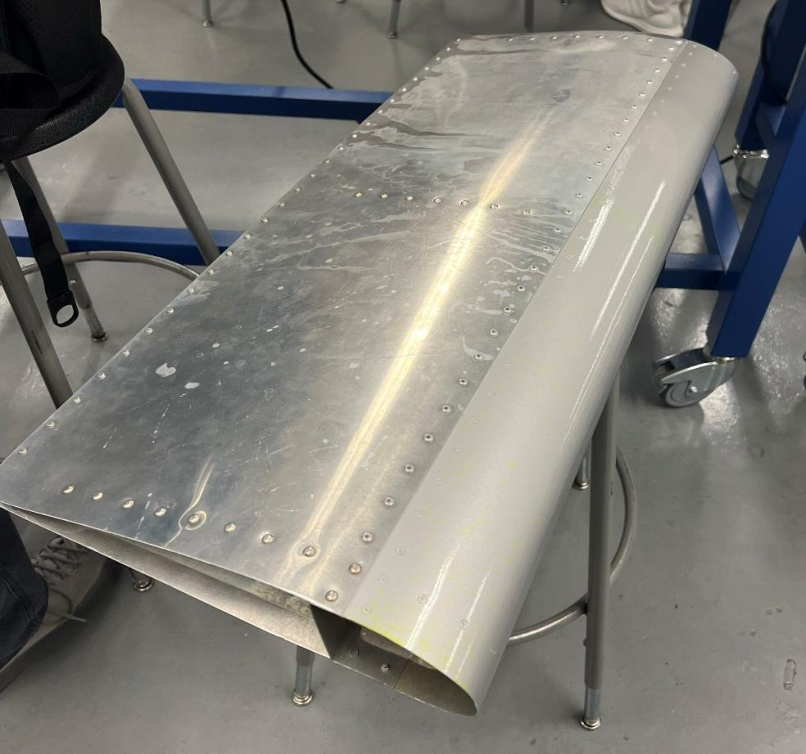
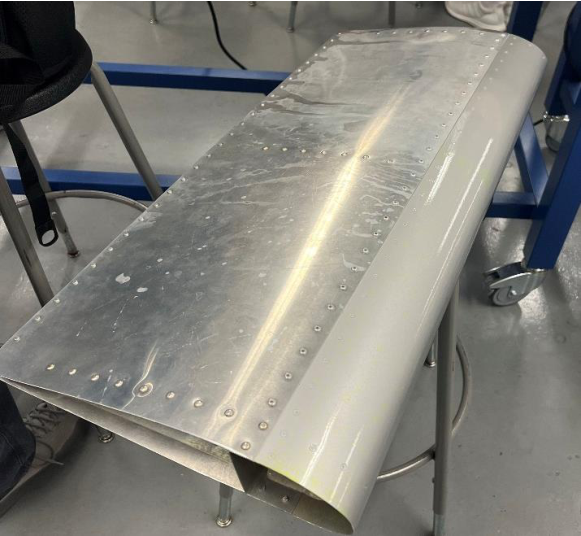
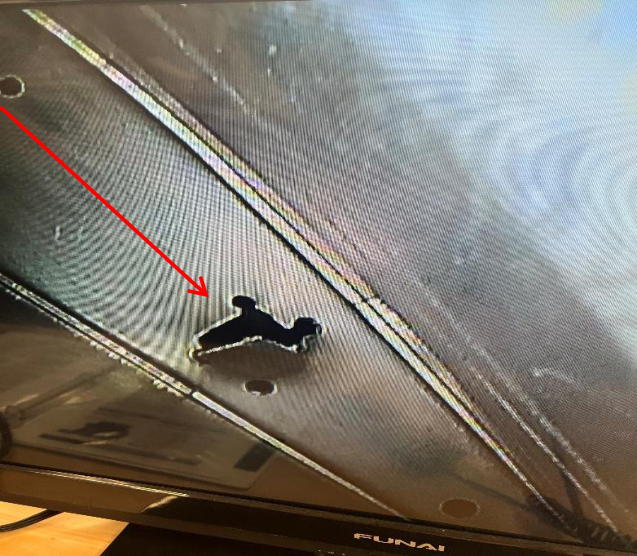
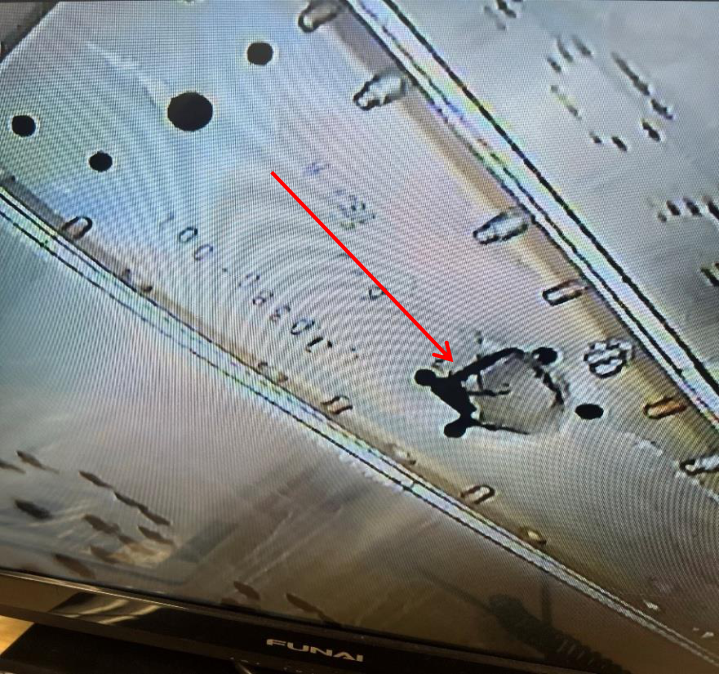
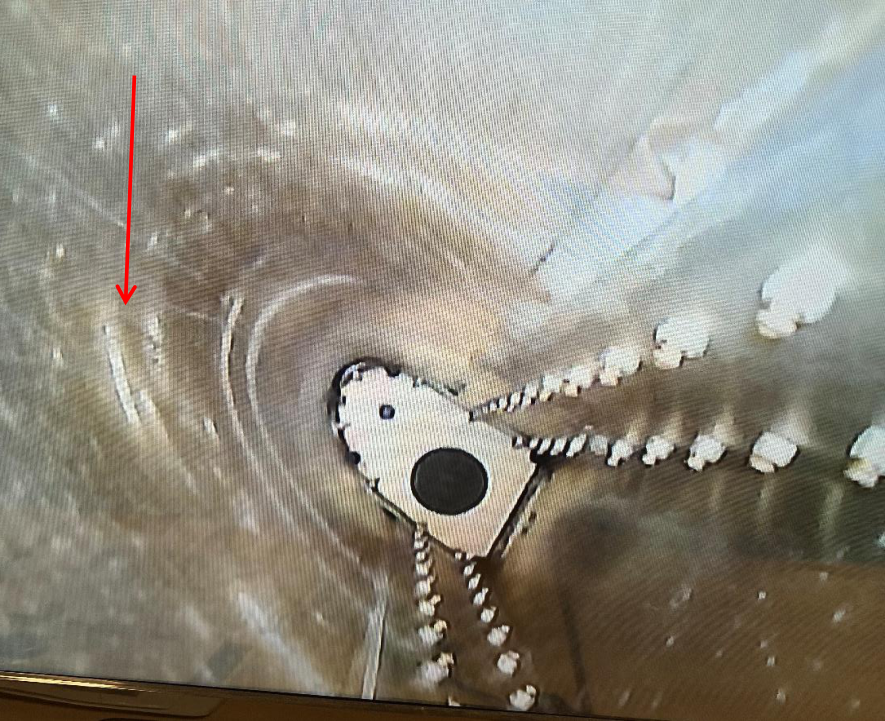
- Visual inspection — borescope examination of an aircraft wing airfoil interior for cracks near rivet holes
- Thermography — FLIR T440 infrared camera detecting surface temperature gradients
- Radiography — X-ray imaging of a welded aluminum plate to visualize internal structure
- Liquid penetrant — fluorescent dye/developer revealing surface discontinuities under UV light
- Ultrasonics — 5 MHz piezoelectric transducer mapping echo time-of-flight vs. thickness
Equipment & Tools
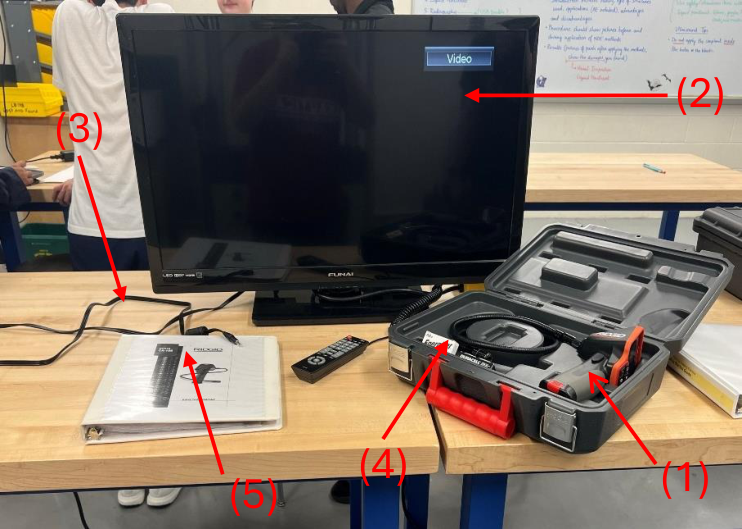
- Ridgid Micro CA-150 borescope inspection camera with Funai LED display and RCA cable
- FLIR T440 Thermal Imaging Camera
- X-ray system with digital flat-panel detector and imaging computer
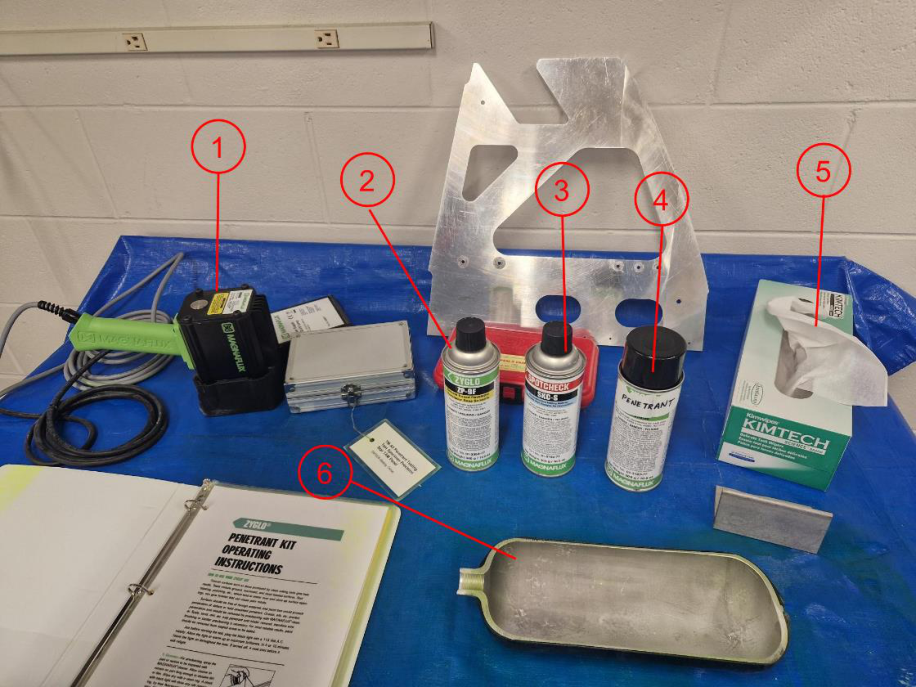
- Liquid penetrant kit: SD-1 cleaner, ZL-60D fluorescent penetrant, ZP-9F developer, and 365 nm UV light
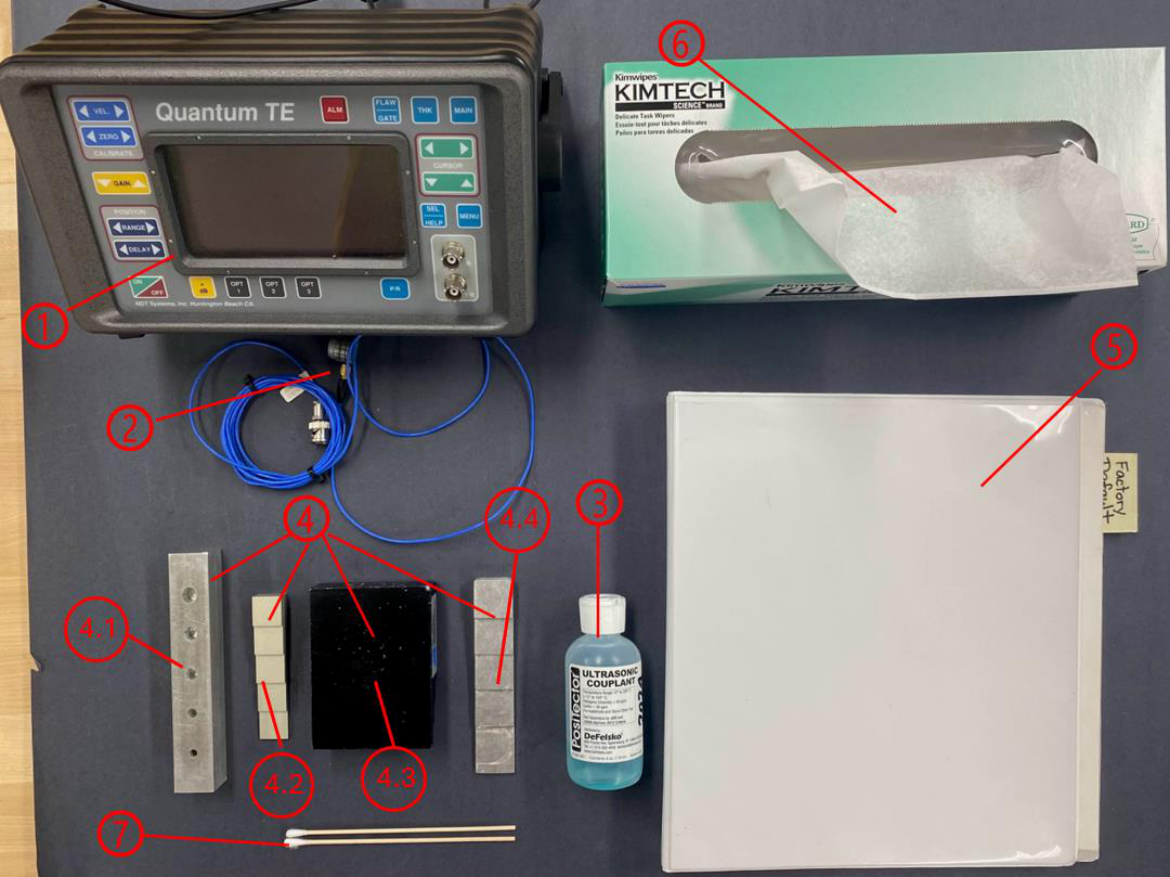
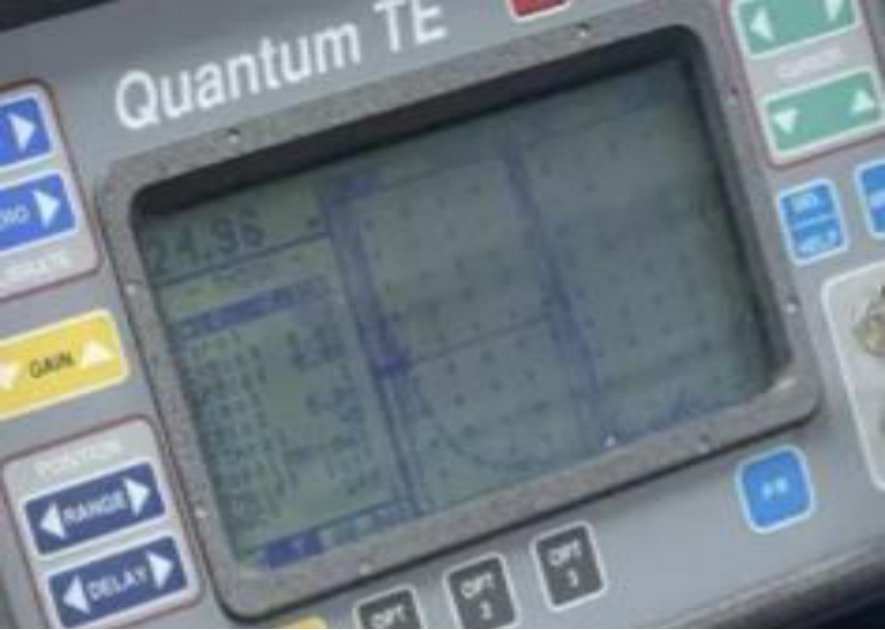
- Portable Quantum TE ultrasonic inspection device with 5 MHz piezoelectric transducer
- DeFelsko ultrasonic couplant and aluminum stepped calibration blocks (SCB)
- Aircraft wing airfoil section, aluminum pressure vessel, and welded aluminum plate
Visual Inspection – Borescope
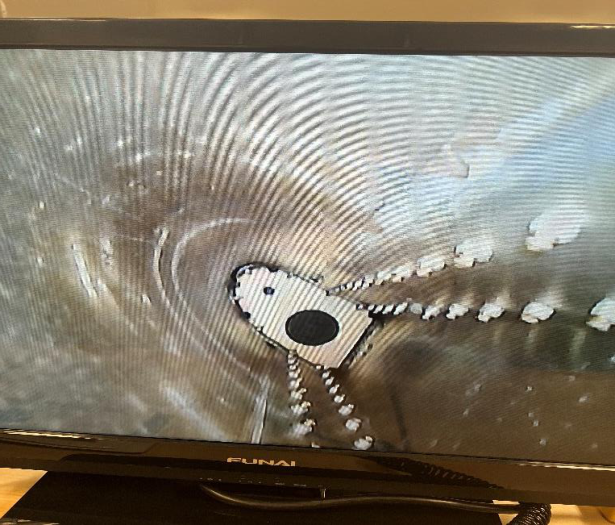
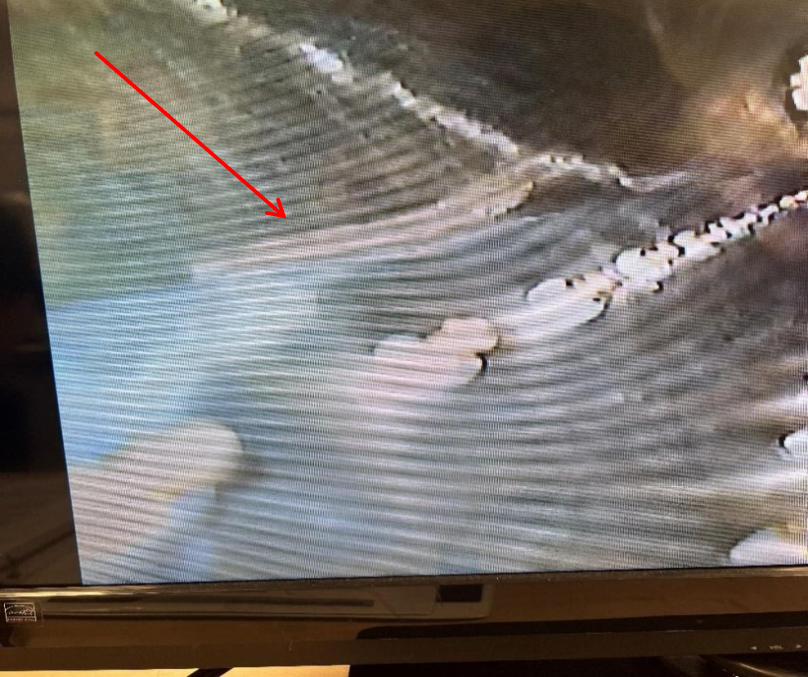
A Ridgid Micro CA-150 borescope was inserted into the interior of a metallic aircraft wing airfoil section and navigated along the inner skin surface. Under the enhanced lighting of the borescope, visible scratches and cracks near the rivet holes were identified — the type of stress-concentration-driven fatigue damage that motivates maintenance inspection intervals for riveted structures. The borescope proved effective for hard-to-access interior surfaces that no standard optical tool could reach.
Thermography
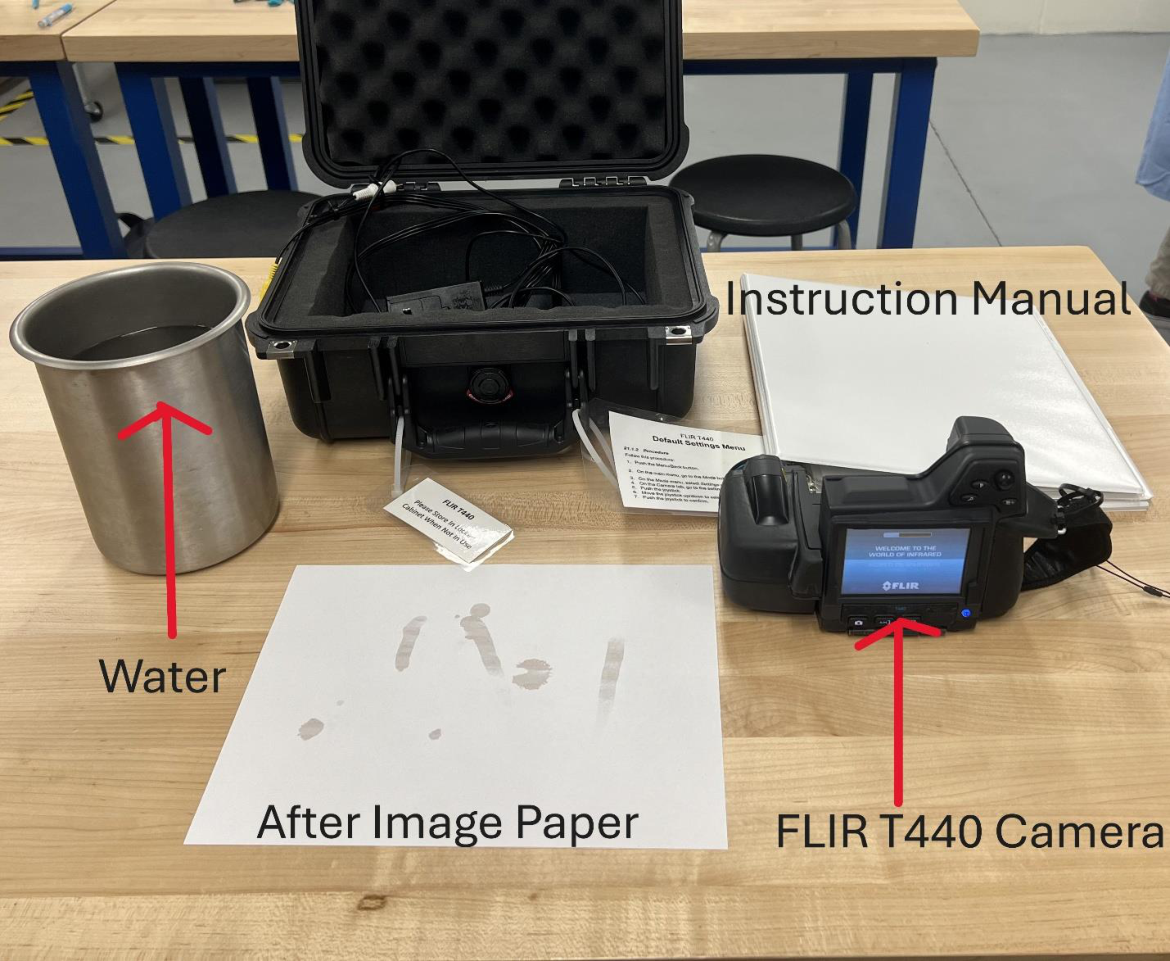
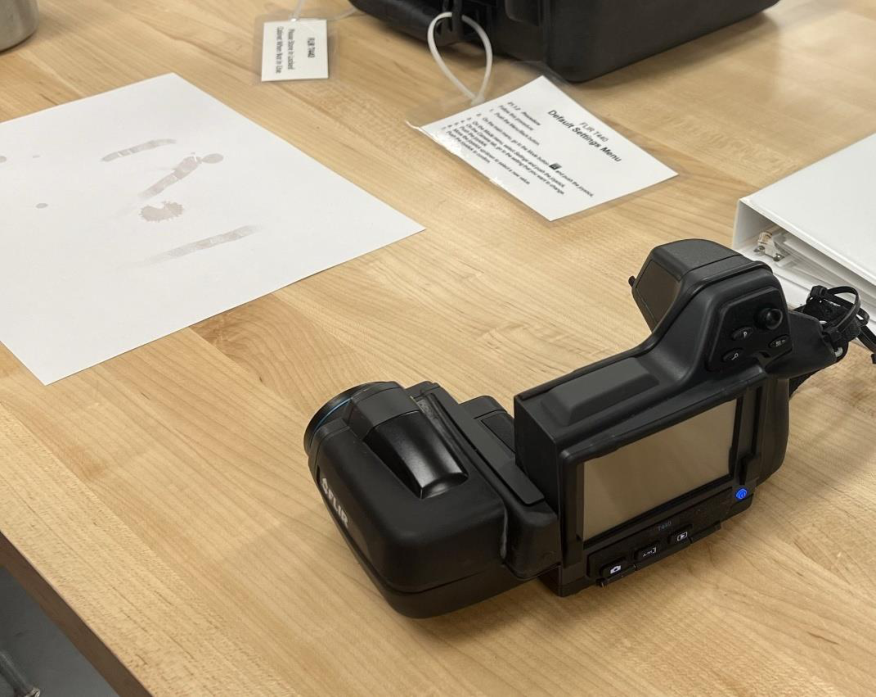
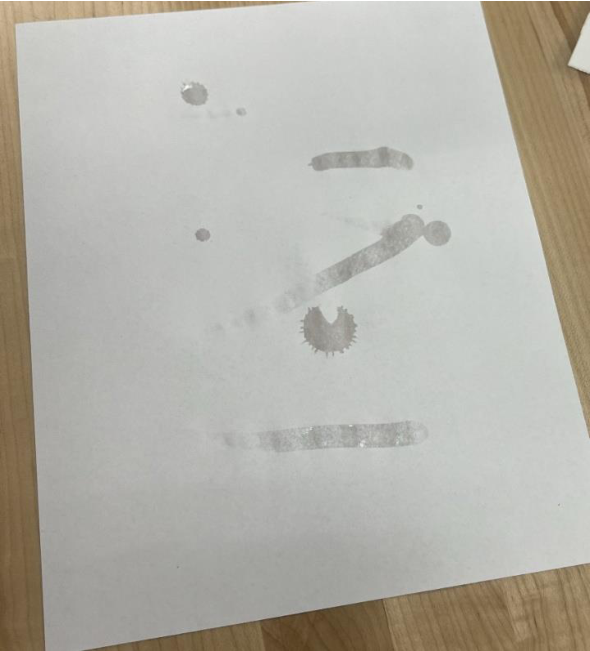
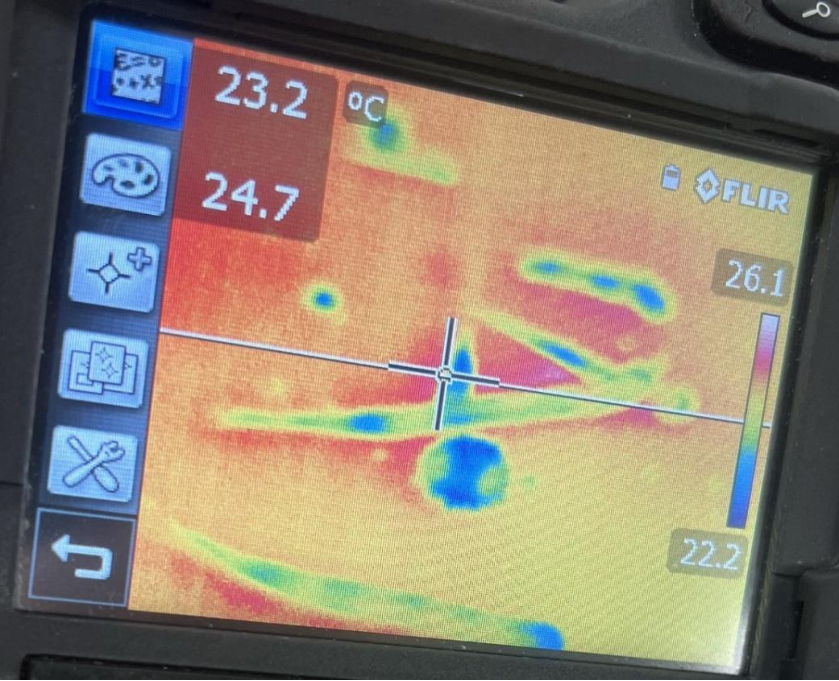
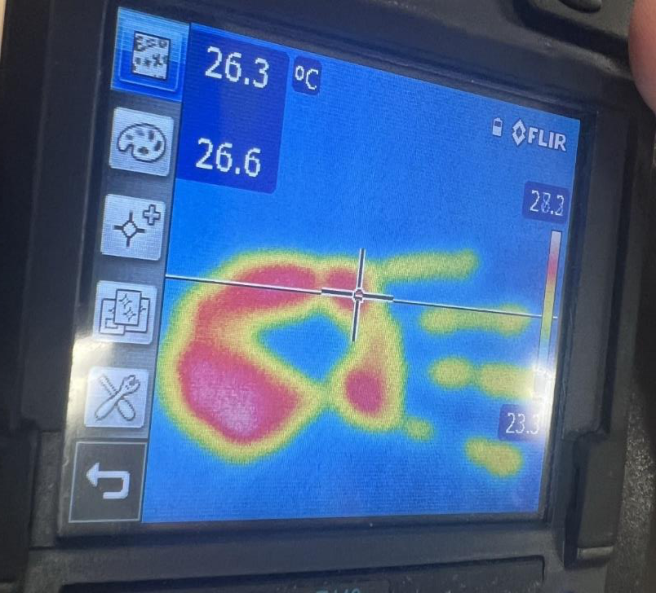
The FLIR T440 camera imaged a paper subject before and after applying cold water droplets and a hand imprint. The camera resolved temperature differentials at the ±0.1°C level, with cold water appearing as cool blue zones (22.2°C) against the warm amber background (26.1°C), and the hand imprint glowing red at 26.6°C. This demonstrated how thermal gradients reveal material non-uniformities, disbonds, and coolant leaks in aerospace hardware.

Radiography
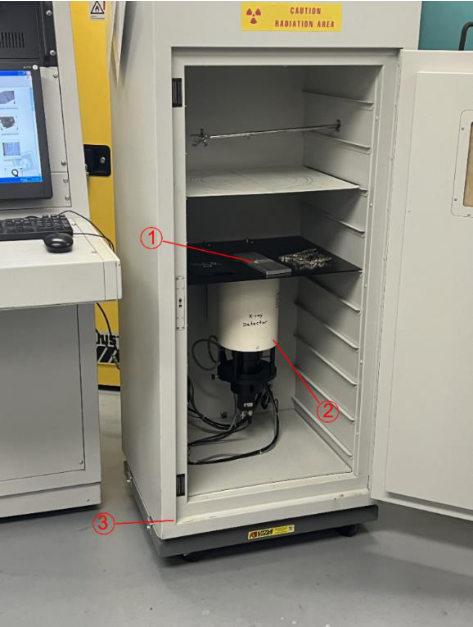
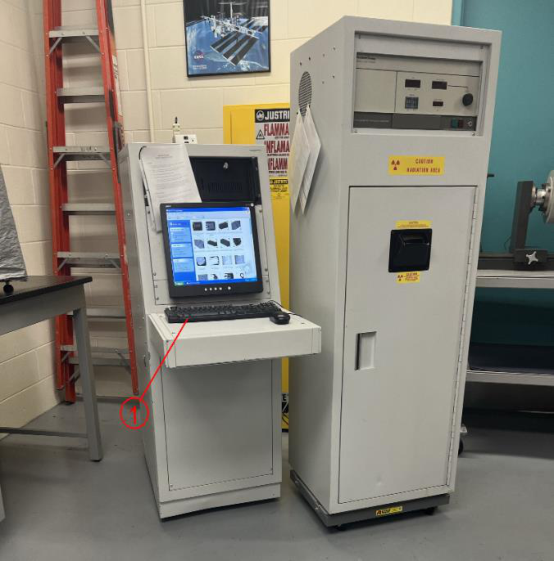
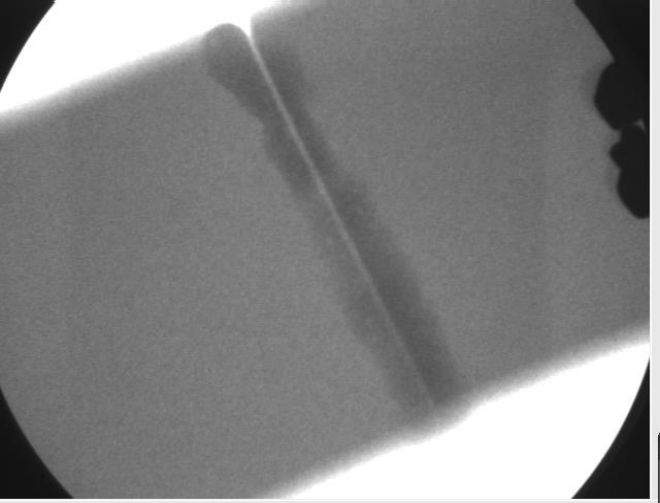
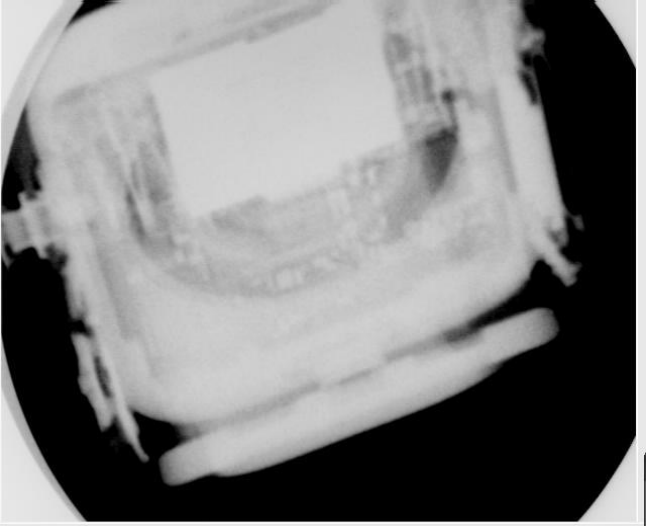
X-ray images of a welded aluminum plate revealed the weld bead geometry and internal profile useful for quality assurance. An Apple Watch image illustrated how overlapping components complicate defect discrimination in complex assemblies — a known limitation of 2D projection radiography. The X-ray system required a dedicated computer and shielded enclosure for operator safety.
Liquid Penetrant
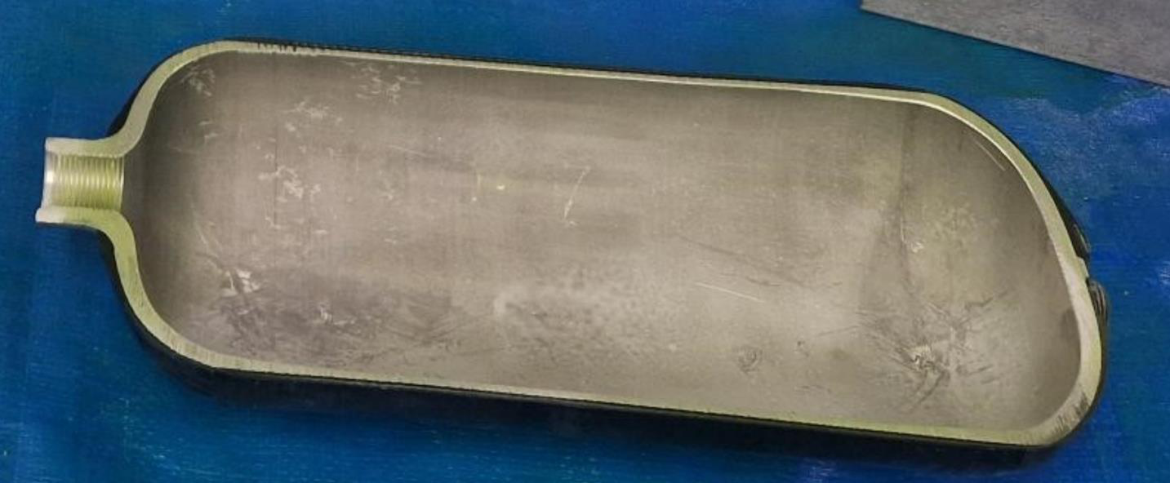
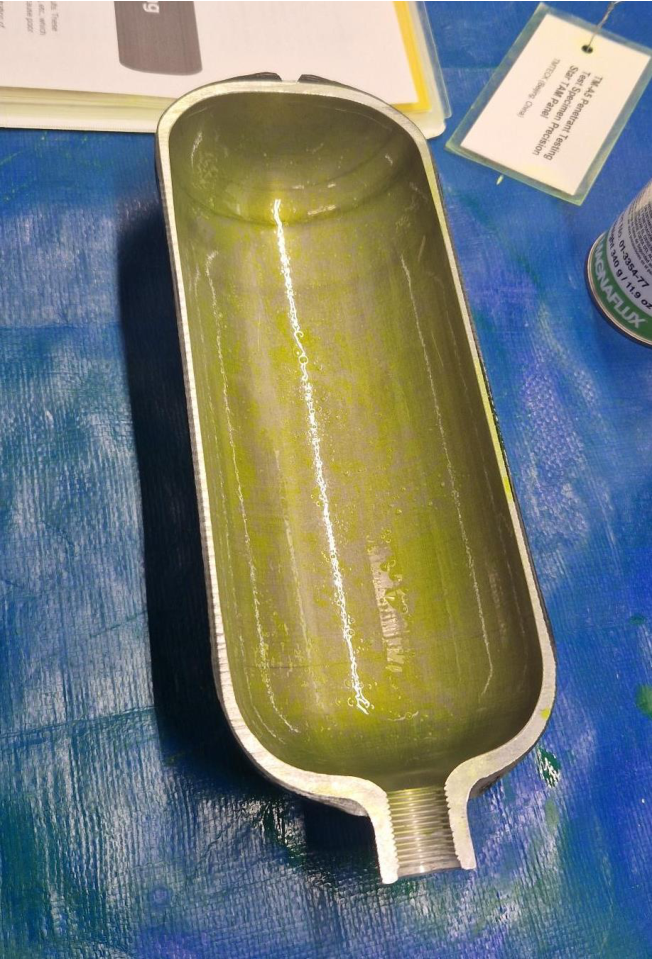
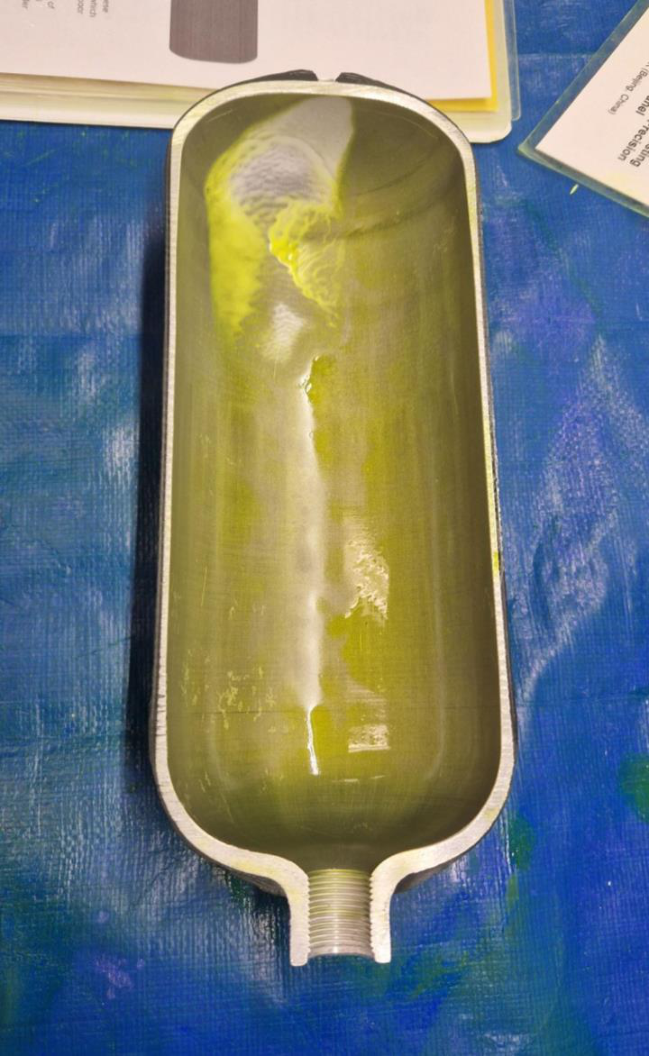
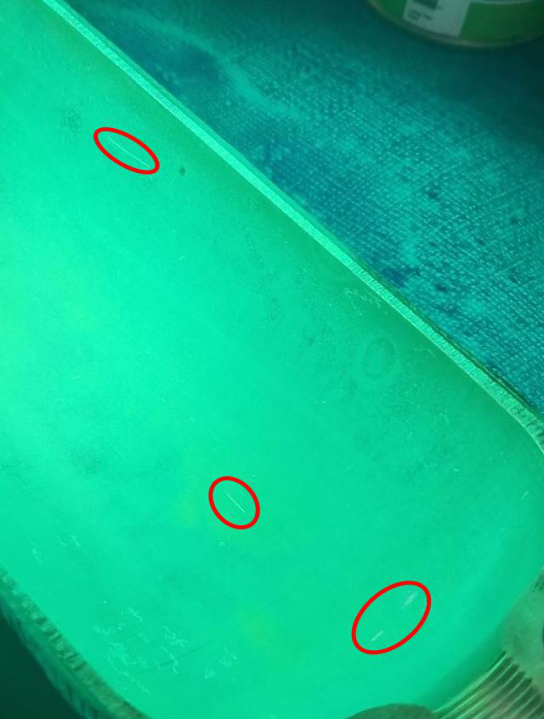
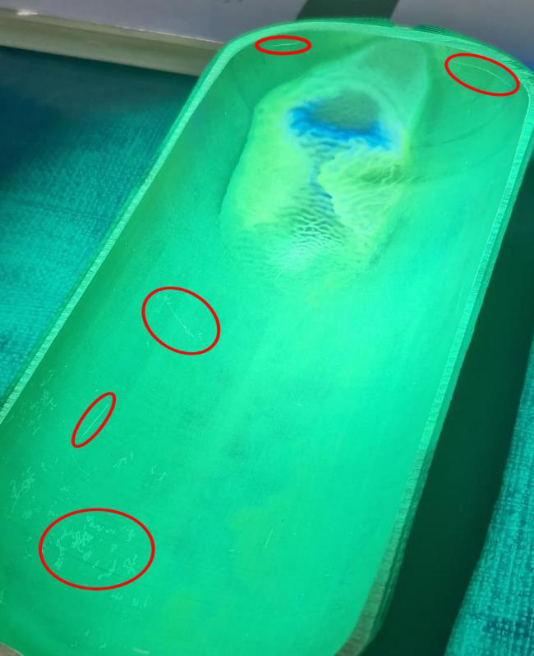
A fluorescent dye was applied to an aluminum pressure vessel and allowed to dwell for ~10 minutes before being wiped and developed. Under UV illumination, at least eight discrete damage indications appeared as bright zones against the green developer background — scratches and cracks completely invisible under normal white light. This demonstrated the technique’s superior sensitivity to shallow, tight surface discontinuities.
Ultrasonics
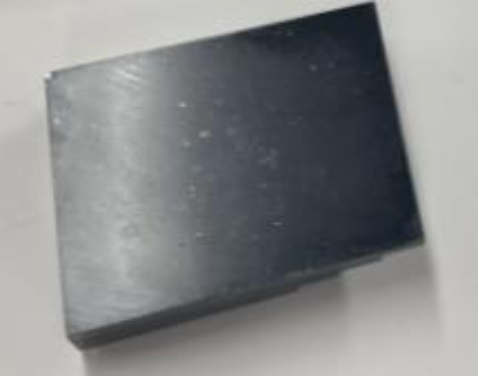
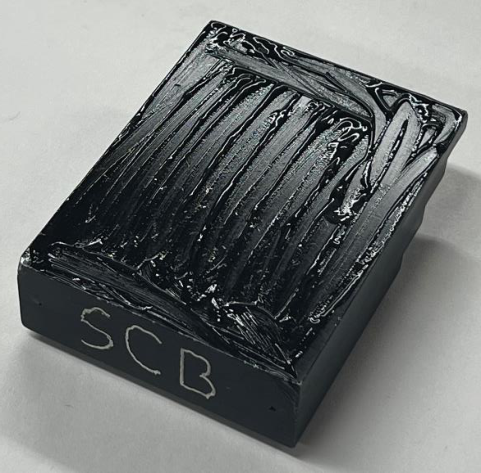
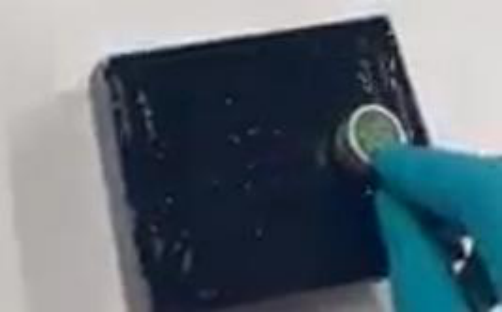
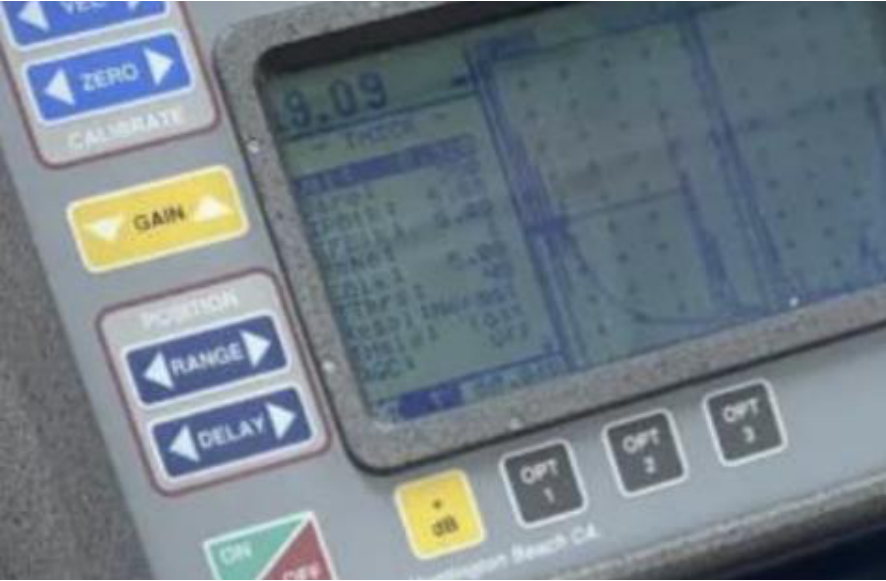
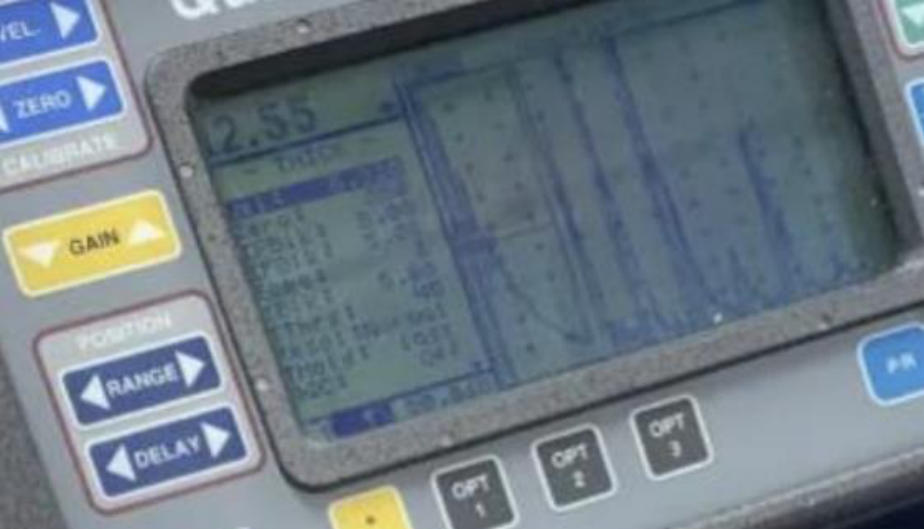
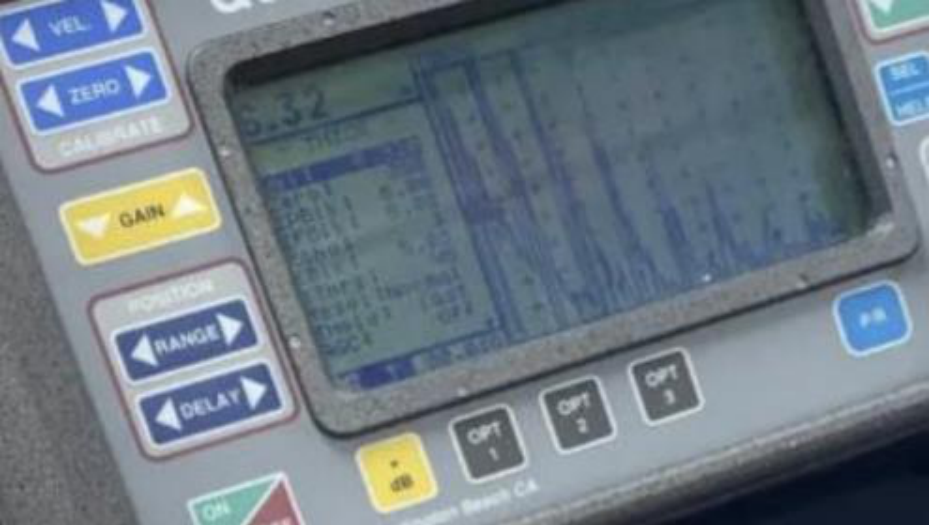
A 5 MHz piezoelectric transducer was coupled with ultrasonic couplant to stepped aluminum calibration blocks (SCB). As the probe moved from the thickest section (~24.96 mm) to the thinnest (~3.32 mm), echo spacing in the A-scan decreased proportionally, tracking known thickness steps with clear step-wise echo patterns. Ledge edges produced slight amplitude reduction from scattering, validating the technique’s sensitivity to internal geometry changes — the same principle airlines use to monitor skin corrosion on aging aircraft from the outer surface.
Valuable Takeaways
- No single NDE method catches everything. Visual inspection misses subsurface cracks; ultrasonics misses surface-only defects; liquid penetrant only works on non-porous surfaces. Professional inspection programs layer multiple techniques — the same approach a licensed A&P mechanic applies to airframe maintenance.
- Liquid penetrant reveals defects invisible to the naked eye. Finding eight surface indications on a visually clean part is a powerful demonstration of why NDE is mandated in airframe certification and maintenance schedules.
- Ultrasonic thickness gauging is the industry standard for corrosion monitoring. Echo time of flight scaling linearly with thickness — demonstrated on calibration blocks — is exactly how airlines measure skin thickness on aging aircraft from the outer surface without removing interior trim or insulation.
- Gained hands-on exposure to five certified NDE methods used in FAA-regulated maintenance and manufacturing, directly relevant to structural integrity engineering, quality assurance, and MRO roles.